
Falstad Circuit Simulator: Exporting Oscilloscope Data for Solar Cell Analysis
06 Apr 2025Introduction
The Falstad Circuit Simulator is a powerful free online tool for electronic circuit simulation, offering real-time visualization of electric behavior in circuits. This browser-based simulator stands out for its intuitive interface and animated current flow, making it an excellent resource for students, hobbyists, and electronics enthusiasts.
While more professional alternatives exist (such as SPICE, LTspice, Multisim, or Proteus) with advanced capabilities for industry-level work, Falstad’s accessibility and visual approach make it particularly valuable for educational purposes and quick circuit prototyping.
In this post, we’ll explore an under-documented feature of Falstad: the ability to export oscilloscope data to text files. This functionality allows you to capture simulation results and process them in external graphing programs. As a practical example, we’ll simulate a solar cell equivalent circuit and export the data to generate power versus voltage curves for solar cell performance analysis.
Solar Cell Simulation in Falstad
The animation below shows a dynamic simulation of a solar cell circuit in Falstad demonstrating both the electrical behavior and real-time data visualization:
A direct link for the circuit above running in the circuit simulator is here: https://tinyurl.com/23h9ct2n
The Solar Cell Equivalent Circuit
At the center of the simulation is a GaAsP/GaAs/Ge solar cell equivalent circuit (enclosed in a dashed box) consisting of:
- A photocurrent source (13.7mA) representing light-generated current
- A diode modeling the p-n junction behavior
- A series resistance (Rseries) accounting for internal losses of 1Ω
- A parallel shunt resistance (Rshunt) of 40kΩ
The Test Configuration
The circuit is being poled with:
- A 1Hz sine wave voltage source that continuously sweeps from -0.6V to +2.6V
- Measurement points showing instantaneous values (a voltage source output and one ammeter)
- Two strategic “export” points labeled in the circuit: one for voltage measurement at the cell’s positive terminal, another for current measurement through a 1mΩ sensing resistor.
Real-Time Visualization
The simulation displays two oscilloscope windows attached to the sine wave voltage source showing:
- Current vs. Voltage (I-V) characteristic curve
- Power vs. Time waveform showing fluctuations between -28.2mW and 27.5mW
Another oscilloscope attached to the voltage source output:
- Voltage vs. Power (V-P) curve revealing the maximum power point. It is a trick selecting X-Y type and P output although we are interested to obtain the P vs. V curve.
As the animation runs, you can observe the real-time relationship between voltage, current, and power, with the electron flow animation showing current direction changes as the operating point moves through different regions of the solar cell’s characteristic curve.
Using Export Points in Falstad
After running the simulation for 1-2 complete voltage sweeps across the solar cell, follow these steps to extract the data:
- Pause the simulation by clicking the “Stop” button
- Left-click on the “export” points placed in the circuit
- In the dialog that appears, specify the number of data points
- The simulator will generate a text file containing the time-series data for that point. Save this .txt file to your local drive
- Import the exported data into your preferred graphing software (Excel, Python, MATLAB, QTIplot etc.)
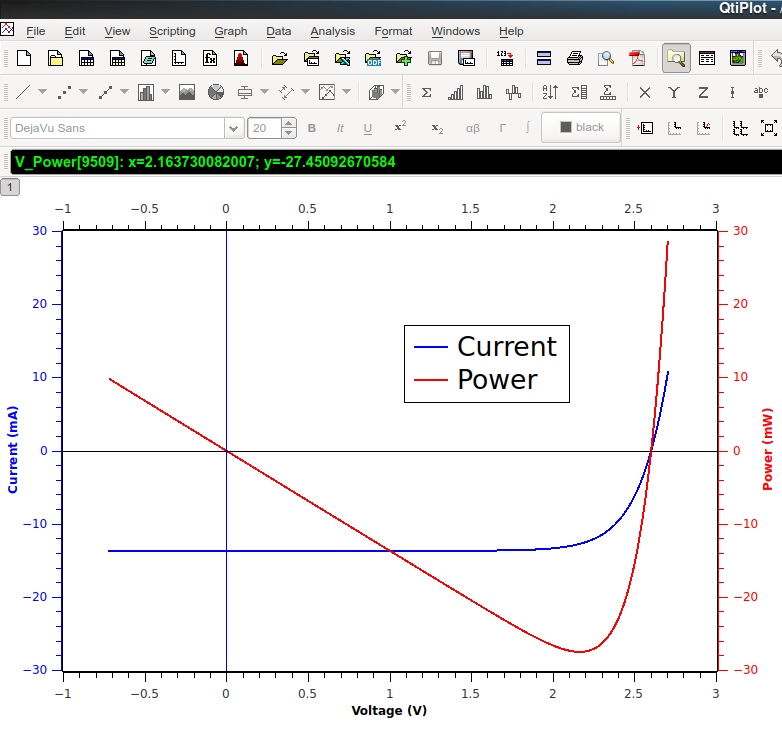 Figure: Graph using QTIPlot
This method allows you to perform more sophisticated analysis than is possible within Falstad’s built-in oscilloscope, including precise maximum power point calculations, fill factor determination, and comparison between different solar cell models.